.jpeg.498813ce7eb5d3c936d5d5a798256129.jpeg)
xxTJRocksxx
Unpaid Member
-
Joined
-
Last visited
Everything posted by xxTJRocksxx
-
So I have a science question, Since we can manually adjust the % of canbus fuel for a given boost, and that % is based off of the base tune / ECU Tune, then we should be able to identify the exact stock ECU target fuel message for each scale? I ask this because say stock injector A (I don't know their specs) Flows 640CC's per event but injector B flows 800cc's per event. Theoretically, if both injectors are parallel in their flow charts then subtracting X% of fuel for B at any given scale would Make its fuel flow mirror Injector A. Obviously the stock injectors do not have a linear flow map, and neither will the aftermarket injectors, so therefore adding and subtracting % along the boost scale will not be uniform like most of our tunes. I understand that the goal is not to mirror the stock injector delivery, but bosch and cummins engineers obviously put time into figuring out how much fuel and when, so I am starting to wonder what the stock fuel curve looks like and not by %, but by fuel message. The reason I bring this up, is running this new tune I am seeing spots where I am over fueling, but also under fuelling later in the map. Also @Me78569 how does the V2.1 timing work, and should I test it? P.S. Does the Quad scale % base its adjustment off of stock fueling at 100% throttle? if so then the maximum would be 4095 Usec, which makes figuring out the flow rates easier. I know you guys are not experts on the tuning, but If you know anything please interject. I am trying to master this so I can contribute to the success of this and your help has been greatly appreciated.
-
Yeah, and coolant was between 175-180* the whole time. this was with A/C on too btw. I am going to run test tune 2 for a few days and see what overall mileage I get out of it.
-
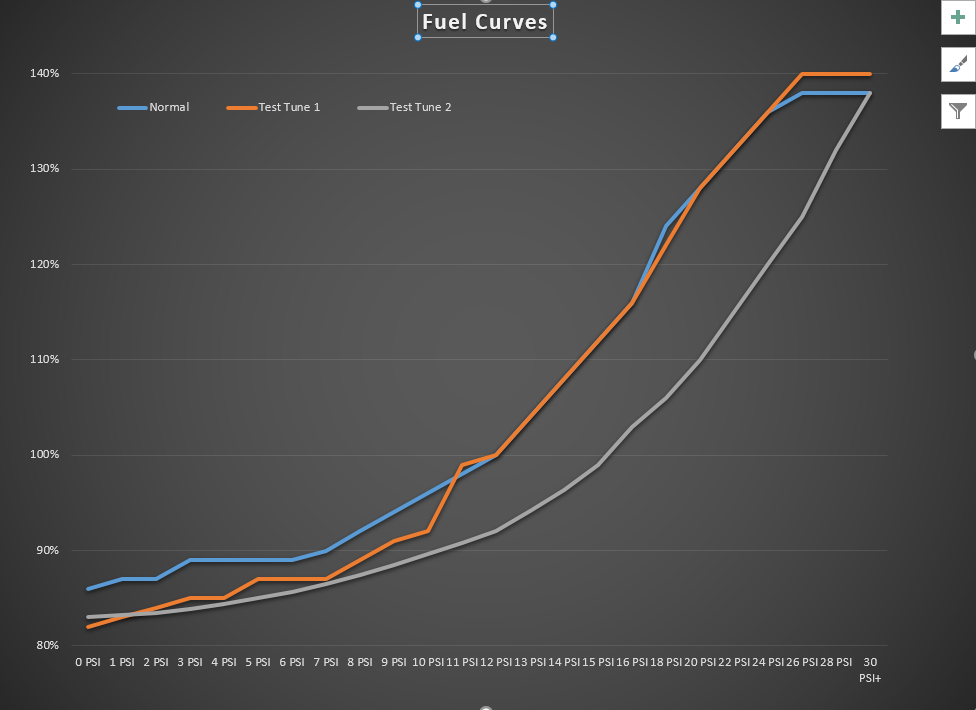
Hey guys, First of all thank you for all of the input. I really appreciate the conversation. Secondly, I drove 48.1 miles on 2 gallons of fuel (23.84 mpg) above 70mph. Timing was relatively stable, but cruise still needs adjusting. 90% of the trip I was running "Test Tune 2", and I just graphed the fueling curve with interesting results. See the tunes below, and the graph of their respective fuel curves. Anyway I think a better starting point for 7x0.010 SAC injectors is between 82-83.5%, and the smooth curve really helped with the timing and cruise. Its not perfect, but I am getting more confident with the tuning, and setting up these different tunes before my trips and switching on the road is a great experiment. @Carbur8tr @Me78569 I am going to get a new thermostat this weekend to see if I can get those numbers up further, but I am very impressed already. Normal Test Tune 1 Test Tune 2 # Power Levels 6 6 6 Timing Limit 15 15 15 Timing Scale 55% 54% 53% Low PSI Timing Reduct 2.5 2.5 2.5 Timing Reduct Scaling 100% 100% 100% Cruise Timing Adv. 3 3.5 3.5 Max Fuel Stretch 1700 1750 1400 TPS Pump MAX 100% 100% 99% TPS Pump MIN 25% 20% 20% Pump Low Boost Limit % 5% 8% 5% Pump Low Boost Scale PSI 10 0 0 Boost Scaling 40 PSI 40 PSI 40 PSI RPM Limit 3200 3200 3200 Power Reduction 15% 15% 15% Normal Test Tune 1 Test Tune 2 0 PSI 86% 82% 83% 1 PSI 87% 83% 83.2% 2 PSI 87% 84% 83.5% 3 PSI 89% 85% 83.9% 4 PSI 89% 85% 84.4% 5 PSI 89% 87% 85.0% 6 PSI 89% 87% 85.7% 7 PSI 90% 87% 86.5% 8 PSI 92% 89% 87.4% 9 PSI 94% 91% 88.5% 10 PSI 96% 92% 89.6% 11 PSI 98% 99% 90.8% 12 PSI 100% 100% 92.0% 13 PSI 104% 104% 94.1% 14 PSI 108% 108% 96.3% 15 PSI 112% 112% 99.0% 16 PSI 116% 116% 103.0% 18 PSI 124% 122% 106.0% 20 PSI 128% 128% 110.0% 22 PSI 132% 132% 115.0% 24 PSI 136% 136% 120.0% 26 PSI 138% 140% 125.0% 28 PSI 138% 140% 132.0% 30 PSI+ 138% 140% 138.0%
-
Oh I agree with you. I have to pick the wife up from PBI airport (30 miles away) so I am going to make a few changes to the tune and try some testing. I will graph the logs and get back to you guys tomorrow. Thanks for the help, I am loving this forum. Not looking forward to changing the Oil press. transducer though, POS.
-
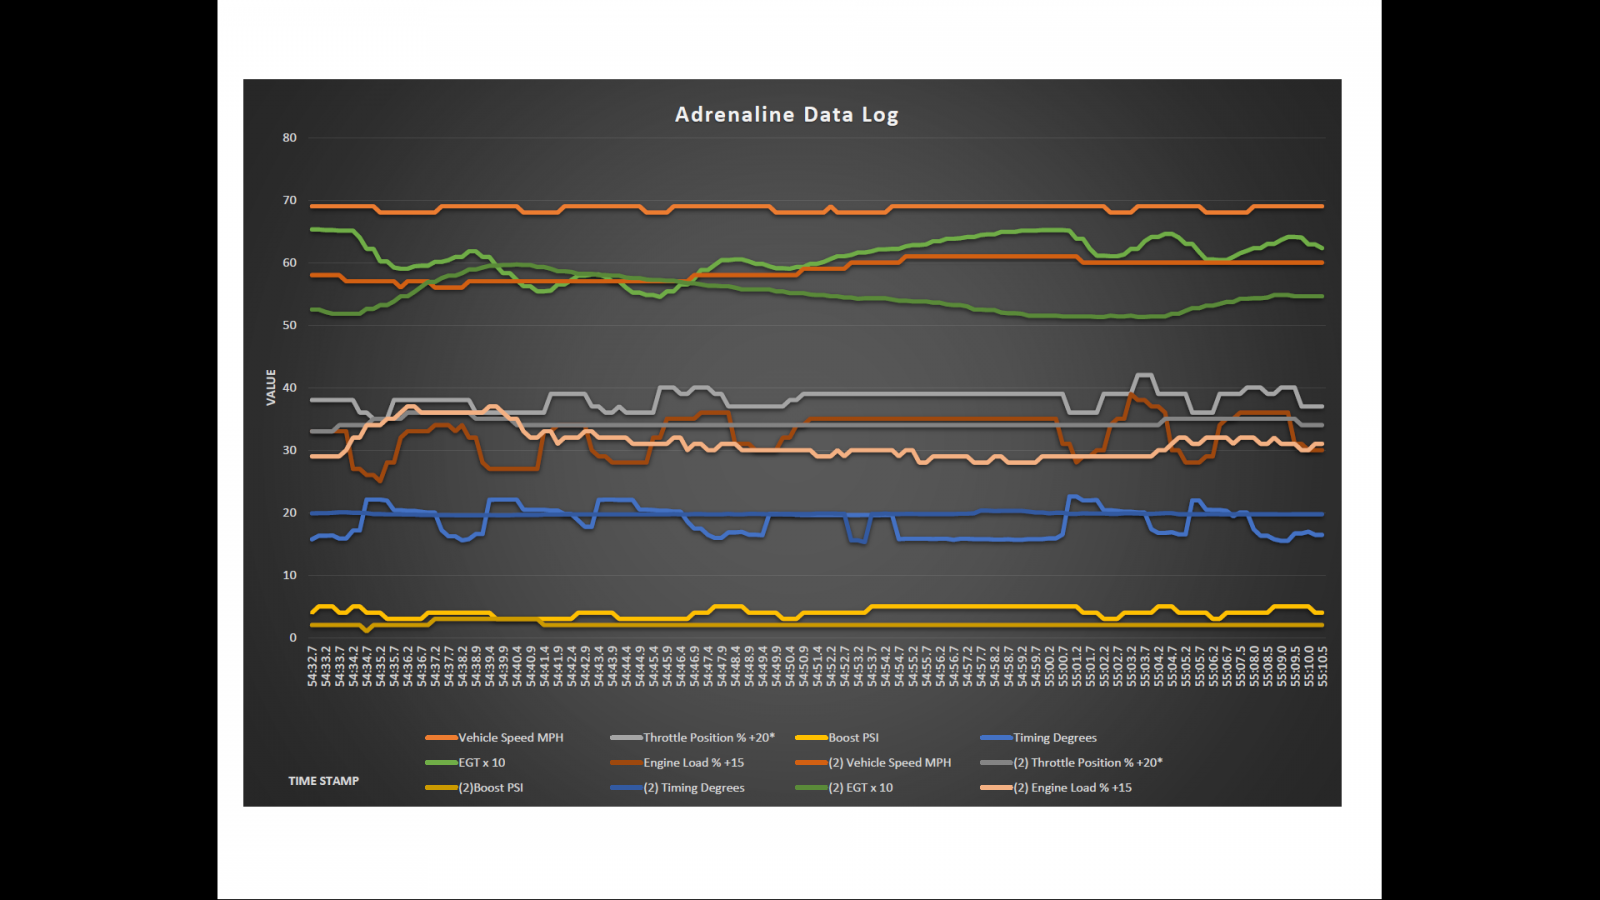
@Me78569 Yeah that makes sense, dammit! As for the graphs, I heavily rely on the chart filters to clutter/declutter the info, so no worries. The tool I made has its limits, but I keep finding ways to improve it. As for the timing, The dark blue line represents timing without cruise control engaged, and the light blue line that dips repeatedly is the timing curve with cruise control on. I admit I should have done two logs at the same speeds, to see if it really is a fueling problem. I really think its just a cruise control problem though, because even with cruise off at 70 mph, the timing stays right around 20* if I don't hit a big hill or move my foot. you can see on the chart that the boost stays very stable with cruise off too. in the .xls attached, I pre filtered everything to be easier to understand, all except graph 450 Cruise VS Foot.xlsx yeah I had it backwards, (2) is cruise off
-
@Carbur8tr @Me78569 See this picture below, this is what I was saying, This is comparing cruise to no cruise, (Series 2 is not cruise, I had that backwards)
.png.3151f546cba2dde005659839d9e32373.png)
-
@Carbur8tr, I bought a cheap 30PSI fuel pressure transducer on amazon, I am waiting for the 100PSI one to be delivered. I have a FASS system, and a gauge on the column reads PSI directly at the pump, its always stable and above 15psi, whereas the one for the quad in plumbed in about 12 inches from the VP44. I have 1/2" Doublewall hose from Tank to Bank, and a Tank Sump for good delivery. My oil pressure always reads 102 PSI, I believed all of the cummins were like this because the ECM receives the oil pressure data in an unreadable format. My truck hardly ever reaches coolant temps above 178* unless I am hard on it, I think its because of the thermostat. The previous owner put the engine in, and he was pulling a 40' goose neck every day for a solar business, so it is possible he put a cold thermostat in. I have vacuum cruise control and under 70mph, it likes to hunt for the speed, which you can see in that log. with cruise on the TPS% will constantly oscillate a few percent, and I am pretty sure this is the problem with the timing. @Me78569 the data you have displayed above is me driving with cruise off, so my foot is not steady and neither is speed. If you see this view below, Series (2) is the data with Cruise on, and the timing constantly drops, almost exactly the same number of degrees every time. the timing curve even repeats several times throughout the log. I will try pulling a few % from my 3-7 PSI scales as you suggested.
-
I am liking this tune A lot, not really any smoke normal driving conditions, and the off the line is pretty healthy.
-
Cruise control issue: Look at the attached log, gotta figure out why the cruise surges, and throws the timig out of cruise mode. Any ideas on why it surges like this? Cruise VS Foot.xlsx
-
Currently Running this tune, with good results, but thinking about comparing this DD tune to the one @Me78569 just posted. I get a light haze from mine heavy on the throttle, and just a smidge of black smoke during hard shifts. # Power Levels 6 Timing Limit 15 Timing Scale 54% Low PSI Timing Reduct 2.5 Timing Reduct Scaling 100% Cruise Timing Adv. 3.5 Max Fuel Stretch 1700 TPS Pump MAX 100% TPS Pump MIN 25% Pump Low Boost Limit % 5% Pump Low Boost Scale PSI 10 Boost Scaling 40 PSI RPM Limit 3200 Power Reduction 15% 0 PSI 85% 1 PSI 87% 2 PSI 89% 3 PSI 90% 4 PSI 92% 5 PSI 93% 6 PSI 94% 7 PSI 95% 8 PSI 95% 9 PSI 96% 10 PSI 97% 11 PSI 98% 12 PSI 100% 13 PSI 104% 14 PSI 108% 15 PSI 112% 16 PSI 116% 18 PSI 120% 20 PSI 124% 22 PSI 128% 24 PSI 132% 26 PSI 136% 28 PSI 138% 30 PSI+ 138% I am going to try your tune out with the 7x.010 SAC, I will log a couple trips and let you know how it works, I like the fuel curve on that one Also, you have 17 PSI listed, my Quad jumps from 16-18-20. is that an issue?
-
@Carbur8tr, Thanks man, I put a good amount if time into it. I even made one of the non importing tools a comparison type, so you can plot two sets of data on the graph (Great for Tune comparison). We need to design a macro with button controls to turn on and off filters, set the range of time stamps to focus on (rather than the multiple graphs I am using), and a way to import data directly from the CSV files, without changing the file names. I was averaging 17.8 MPG fill 2 fill, before the Quad and Compounds. I was only running an Edge EZD1000, and the HX35 choked at 30-35 psi and EGT was a volcano!! Now I have 65-70 PSI capability and if I hold the pedal to the floor on my daily tune, it never gets above EGT 1260* Comparisson tool.xlsx
-
@Me78569 That makes sense now, because the timing reduction seemed to follow the TPS. So I need to figure out why the TPS is so jumpy, and troubleshoot the surging cruise control.
-
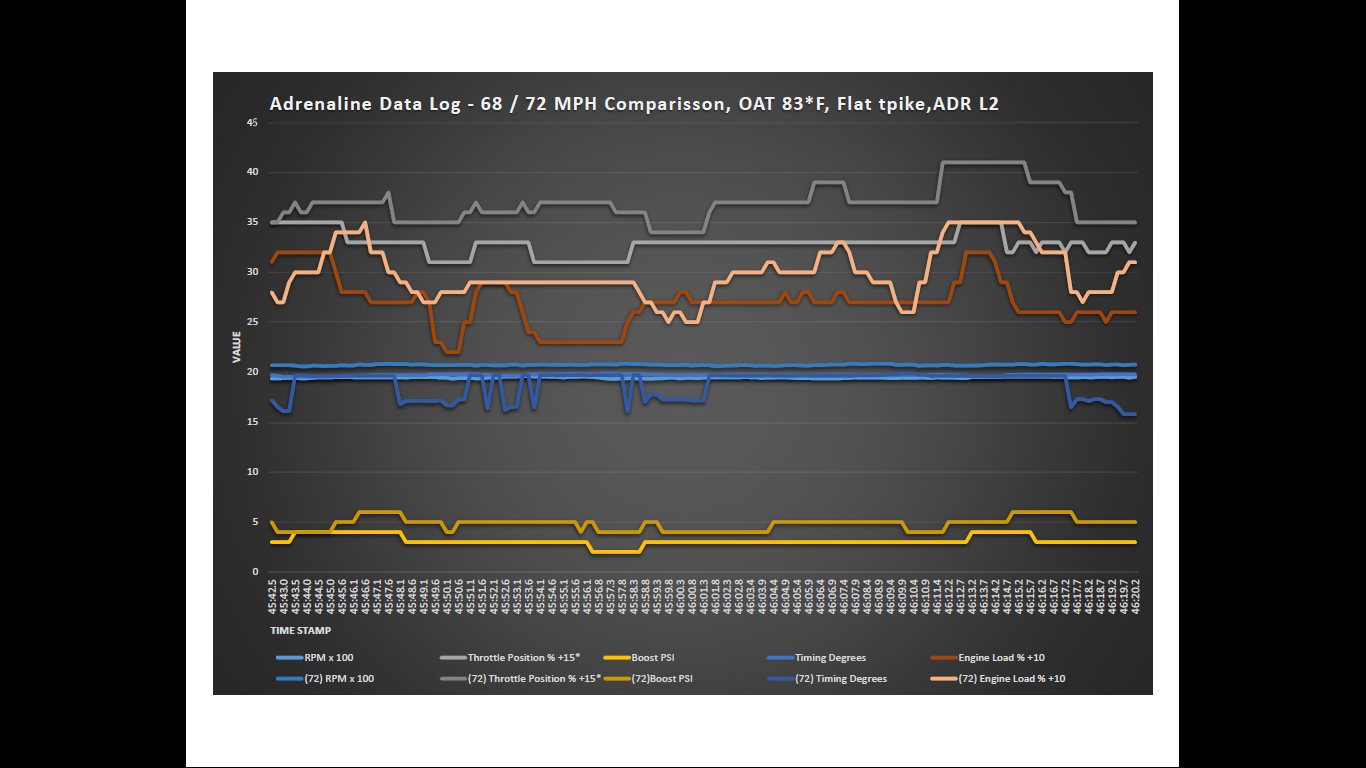
Did some more logging today with interesting results. the tune I am running is my "norm 3 tune in the tunes file. So I ran two logs, one at 68MPH, and the other at 72. both with cruise control on, and on the 68 MPH graph timing stayed almost always above 19*. at 72, I did see more timing, but it also dropped to 16* pretty often. The engine load was very similar, but a couple of observations: -Increasing throttle % does not = Timing reduction, but decreasing throttle pulls timing consistently. -Timing usually remained steady, as long as the Load%>Throttle%. Speed was consistent and there was only 1psi more boost at 72 than 68. I am wondering if my APPS could have a weak spot between 22-26% throttle, because the throttle curve was not steady at all at 72. Norm 3 Tune 72 68 mph comparrison.xlsx Iquad tunes 11.22.16.xlsx
-
Check your tune to see where the max rpm is set
-
Look at the RPM's Too, I believe the back down% is high because he hit the quad rev limit for his tune, so it would pull all the fuel it can to regulate RPM right?
-
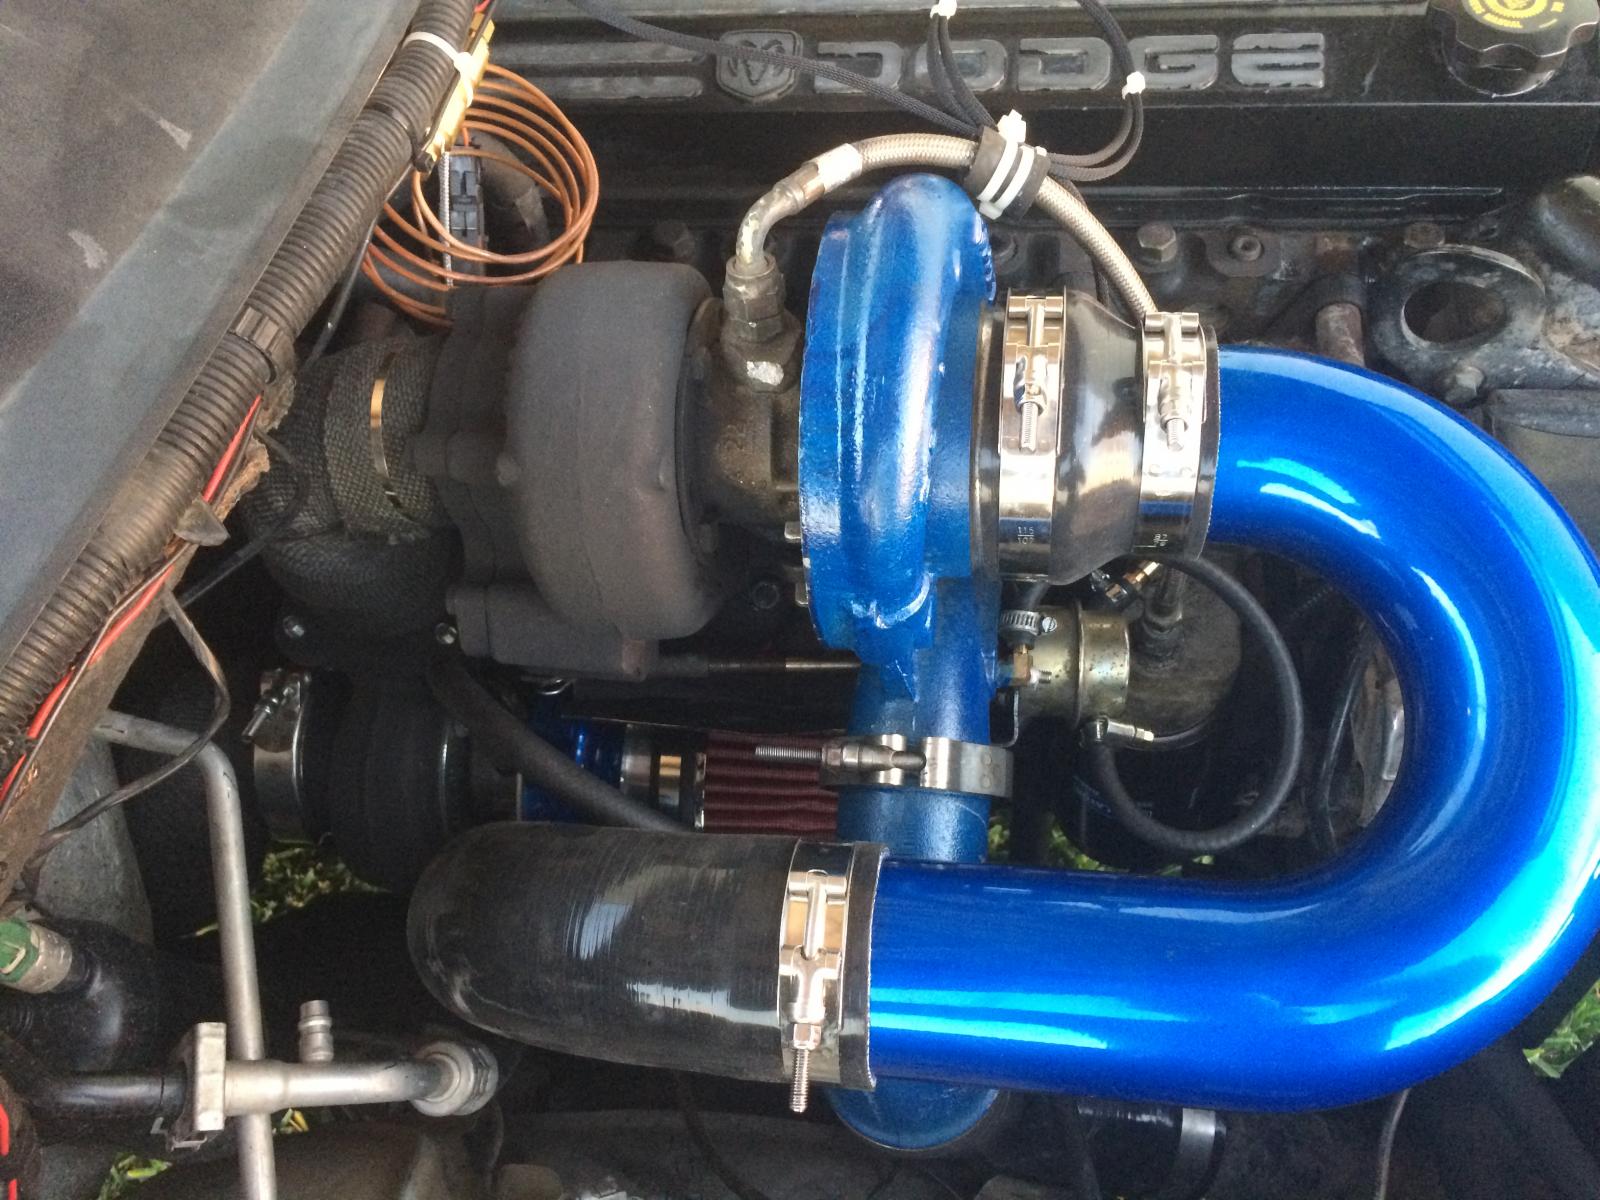
@leathermaneod I can tell you that 7x.010 SAC injectors and a stock HX-35 = High EGT's, Even with defueling the quad, it still wanted to peg the egt gauge, which led to my recent purchase of the Evil Fab 550HP Compound turbo kit S366/HX35. for 1500$ it took me 10 hours to install and the hardest part was disassembling and re clocking my stock turbo. Now my EGT's never climb above 1260* and I have boost any time I want it.
-
Here is a log from driving on the highway tonight on Pwr LVL 3. I was playing with throttle and speed to see how timing curve was translating, this DD tune is running 15* max timing @ 55% Scaling. I am pretty pleased with overall performance, I just need to stud my head so I can run more than 40lbs of boost from the compounds. Overall I feel the Quad V2 is pretty awesome, I just wish there were better articles explaining the effects of fuel timing for diesels, without re studying thermo-dynamics. Having a GM LS / Jet engine background helps, but ignition timing in a gas engine is way different, and a TFE 731-60 Continuously sprays fuel after light off. normal tune 3 lvl 3 11.22.16.xlsx @Me78569 Have a look at this revised tune in column ""Norm 3". I added a few percent fuel to the maps that the load was not following the throttle pos. I am wondering if I need to up the timing reduct. scaling for these scenarios, and pull some more timing during acceleration to help spool the turbo. My boost on the last map I sent looks to lag quite a bit even though it did not feel like it on the road. Iquad tunes 11.22.16.xlsx
-
4.10's??? Dang I never thought about that, I thought the 3500 came with 3.55's. I agree on the timing, although it seems like above 70 mph, timing likes to hang out near 15-18*.
-
65-70, 1980-2100 rpm, its on the logs I posted.
-
@Me78569 Here is a few Data Logs I ran last night on my different tunes, and a spread sheet with the tune parameters. I'm averaging 19.8 - 20.3 mpg on my work commutes (50 miles mostly flat Florida turnpike). Do you think there is any meat left on the bone? Iquad tunes 11.22.16.xlsx mpg tune lvl 2 11.21.16.xlsx normal tune lvl 2 11.21.16.xlsx race tune lvl 4 11.21.16.xlsx towing tune lvl 2 11.21.16.xlsx Roger that so Factory ECM > RPM+TPS = Major timing control ADR> RPM+Boost+TPS = Timing map
-
Very Interesting! So by using a higher timing max and lower timing scaling % it allows you to get to max timing t sooner in the map than if you just run say 8* and 100%? How does the map compute when to pull and advance timing? I read your post on how the factory tune relies more on RPM, and TPS%, with a small effect from Boost. Does this change with the quad map?
-
@Me78569 Can you explain how the timing scaling works? @Quadzilla Power Regarding the requested "help" info for newbies, it would be nice if the website had good info for the custom tuning parameters such as: Description of the parameter > how increasing or decreasing will affect performance. FAQ questions and answers like "how to increase response" or "how to spool the turbo faster" regarding tuning
-
Hey guys quick question, So I bought a fuel pressure sending unit (see link below), to plug the quad into, to get rid of my FP warning, and for data logging purposes. The sensor I bought is 0-30 psi, 0.5 - 4.5 VDC. The issue is at idle the quad is indicating 53psi of fuel pressure, while the Fass sensor on the column is indicating 17psi. I am going to say that I think the sensors range is out of the quads range but if you guys can confirm that and tell me what the quad range for FP is? This is the link to the sensor: https://www.amazon.com/gp/product/B00RCPDE40/ref=oh_aui_detailpage_o06_s01?ie=UTF8&psc=1
-
Made some changes, and created a "non importing version", that you just copy and paste your data into. Quadzilla Data logging.zip
-
Ok guys, this is the first map I want to post. I am using @Me78569's DD tune with compound turbos, boost limited to 39psi. This was my first pull with the kit, I was screwing around on a long road on the airport I work out of.
.png.3719af0240ad6d0200a62e4191326086.png)
.thumb.jpeg.8a32aec2daaac1b77a29eb3b52b77505.jpeg)